US Indices retraced into mid March
Longer term Gann Master Cycle is still pointing downwards
Introduction
I did not expect the recovery into mid March to be huge last week, but in fact the Gann Master Cycle recovered all the way back into a forecast from a month ago (February 18th 2022).
Many other cycles last week however were pointing upwards, like the 20 year, 40 year and 80 year cycles. The composite of the Gann Master Cycle, the 20, 40 and 80 year cycle still has a good correlation, close to 0.79, with this year’s market behaviour. If we extend it with the 100 and 120 year cycle the composite will only have a 0.19 year correlation so far.
As I mentioned in the last few forecasts which is based on the Gann Master Cycle, I expected a more sideway movement into the third week of March and we may still may not have seen the end of this correction yet before a probable downtrend continues.
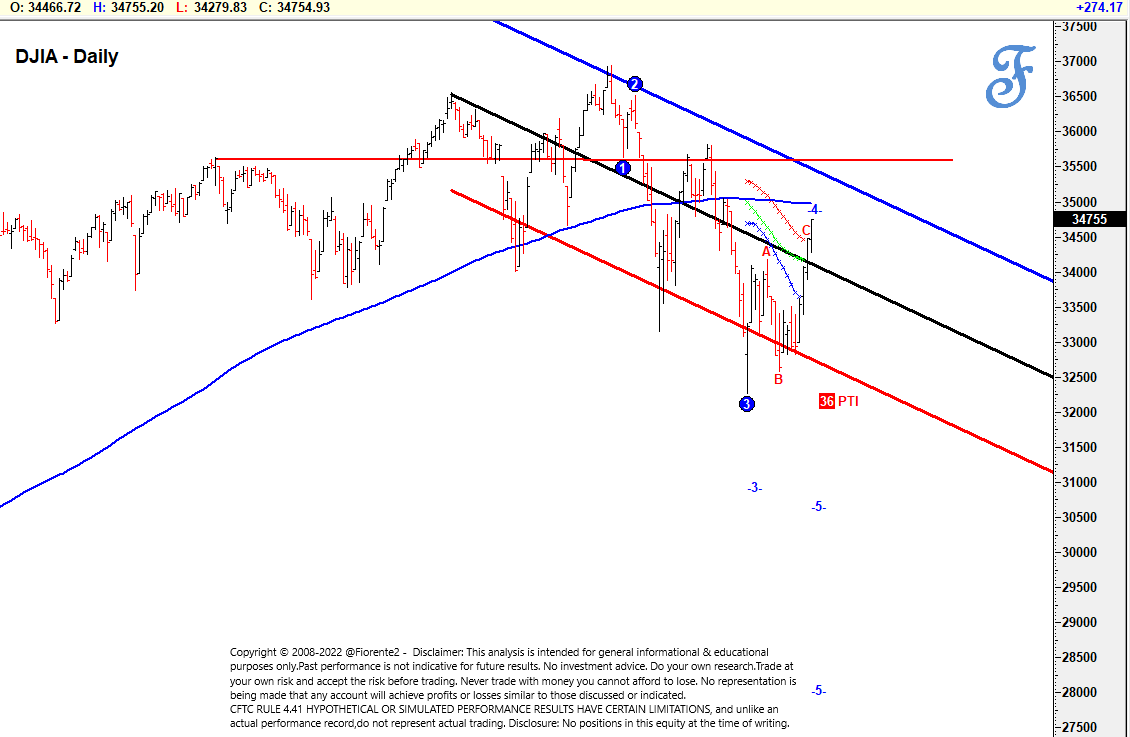
An Elliott Wave 4 of some degree may not have been finalised yet, so a possibility exists the US Market could advance further into the upper part of the regression channel as drawn in below chart of the $DJIA.
Where does the $DJIA go from here. The $DJIA might do a “kiss and Good bye” move from below, cross the 200 day simple moving average or even challenge the upper trend regression line. All possible scenarios.
The quarterly option expiration end of March may cause the market to advance higher into above mentioned targets. A close of some days above 35600 may invalidate this scenario.
If the Russia Ukraine conflict escalates further this may give a total different outlook.
We will have to watch the chart in front of us. Anomalies can happen and if there is a cease fire in the coming weeks this may look favourable for many of the stock indices in the world.
Do not try to catch a falling knife, or step into the market to quickly without any confirmation a change in trend has occurred. So, be careful out there. No advice.
Our paid subscribers here on Substack can continue reading below weekly update on the Gann Master Cycle following the S&P500 and the $DJIA.
P.S.: On all of our communications, posts and analysis our Terms of Use and Disclaimer apply. Hypothetical or simulated performance based on past cycles have many limitations. Hence, past performance is no guarantee for the future. Anomalies can occur and cycles can contract, extend or invert. So, be careful and always watch the charts in front of you.


