Update on Semiconductor Index & NVDA
#244 Applying a Quantum Technology Concept to SoX and NVDA Analysis
Introduction
Yesterday, I demonstrated how you could use planetary lines and price and time harmonics to forecast future resistance and support. It was an extraordinary trade on a European defense stock (Thales S.A.) that went parabolic to the price and time hotspot where I sold making a 77% ROI. You can review the note on Substack here.
In today’s update on the Philadelphia Semiconductor Index ( SoX) and NVIDIA Corporation (NVDA), I will use the same concept of planetary lines, price, and time harmonics to forecast a possible future path.
Planetary lines are akin to employing quantum technology in stock analysis. In his book Quantum Trading, Fabio Oreste integrated W.D. Gann’s concept of planetary lines, which he referred to as Quantum Price Lines. This idea is similar to converting planetary longitude into a price scale using a conversion factor. In my honest opinion, he has put some “old wine in new bottles.
Both concepts deal with Einstein’s theory that the planets may be a cause for space-time to bend. This bending of space-time is what we perceive as gravity. As W.D. Gann mentioned in his Stock Market Course:
There are three important factors to consider: price, time, and space movements.
Nevertheless, it is a good concept, as planetary or quantum price lines are useful for forecasting future support and resistance areas and identifying potential inflection points in price and time. I will use the basic idea of Gann’s Planetary Lines in the example below on the Sox and NVDA.
You can often use the longitude of Saturn, Uranus, Pluto, or Neptune to find the longer-term planetary lines that form support and resistance. While using the planets with a smaller orbit, like Venus or Mars, most of the time, you can find the trade channels up or down.
The conversion factor largely depends on the stock price. In principle, it can be any harmonic number (or inverse variation) of 360 as part of a circle (360 degrees).
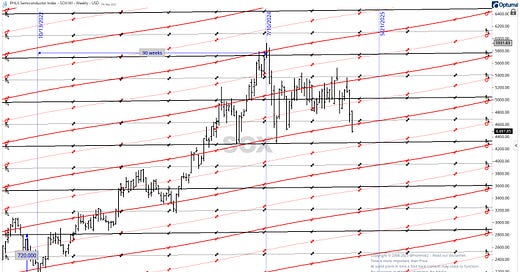
In the above example, I used a conversion factor or price unit of 2 in Gann’s terminology for both the 360-degree Conjunction and 180-degree Opposition. You could start with a price unit of 0.1 or 0.01 for smaller stocks (<360) to find a good fit with the longer-term or smaller planets.
Here, the planetary lines of Saturn and Mars are a good fit, with significant support and resistance lines. Any crossings over the line from below or above may bring the stock up or down to the next level. When Saturn and Mars’s lines intersect simultaneously, that may become a future inflection point for the trend to change or continue.
Note that the July 2024 high on the SoX was 90 weeks from the low of October 2022 and five times $720 or $3,600 higher from its low at around $2,200. This is a hard planetary angle (90 weeks) or planetary line to surpass (Saturn).
In this updated post, I will further explore the SoX-Index possible forecast, incorporating price and time cycle harmonics and performing a similar analysis on NVDA.


