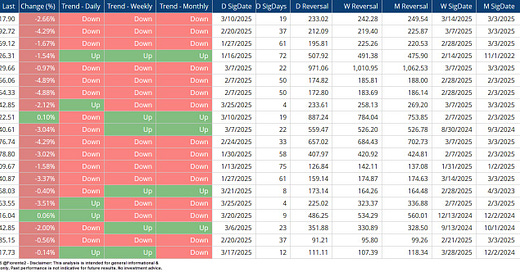
Most of the stocks that contributed to the US indices reaching an all-time high on February 19, 2025, are still trading below their daily, weekly, or monthly breakout levels. This leads me to ponder whether we have yet seen a low in the US indices.
Last week, I noticed an interesting Fibonacci Harmonic Pattern that may be emerging in the US Indices. Almost to the day and hour, based on the hourly chart, the US Indices made a turn on March 25/26 of last week. Will the Fibonacci Sequence continue to unfold in a symmetrical form?
As the US is set to implement additional tariffs on goods and services on April 2nd, 2025, we may likely see continued volatility in the next few weeks, which may persist until the last trading day, April 17, just before Easter.
I have updated the charts in this post and added an additional chart of the S&P 500 to illustrate how square-out parabolas in price and time can forecast future support and resistance lines based on past parabolic moves.


