The Hidden Secrets of Declination
#174 An update on the US Indices: DJIA, S&P500, Nasdaq Composite
Introduction
Last week, I told a story based on the One Thousand and One Nights. These stories originate from Middle Eastern folktales. Often, folktales and various religious scriptures contain valuable information about cycles. This was the ancient way to convey knowledge through many generations. A cycle of a 1001 trading day, or close to 48 months, can be linked to a cycle found in the financial markets. I have shown last week how this cycle was a guide in the past and when it may repeat in the next few weeks.
There is no guarantee that this cycle alone will cause a change in trend. There are more active cycles, and they act like Wheels within Wheels, cycles within cycles. In the past few months, a long-term cycle was in force, and this may be the 60-year Gann Master Cycle we follow every week in my posts.
There is also a medium-term cycle that is associated with the Declination of the planets and the Moon.
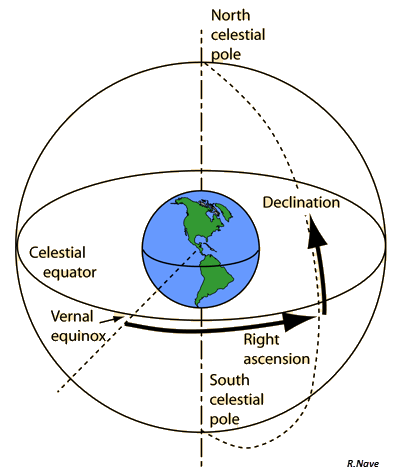
Declination is a term used in astrology that refers to the position of a planet or celestial body in relation to the celestial equator. This measurement is crucial because it provides essential information about the planet's location in a natal chart or when it reaches certain peaks or bottoms in financial markets.
By looking at a planet's declination, astrologers can gain insights into various aspects of life, including financial markets. For example, the position of Venus, Mars, or the Moon in declination can give clues about the stock market, currency fluctuations, and commodity prices. Financial Astrologers can also identify patterns and relationships between planets and market conditions that may not be immediately apparent by looking at their position in the zodiac alone. Hence, declination is an important cycle to consider in financial astrology.
In my weekly post today, I will analyze the declination of Venus and Mars on the DJIA chart to provide additional insights into the current position of the stock market. Moreover, I will demonstrate how planetary lines on various US Indices form crucial areas of resistance and support, which may indicate possible turning points ahead. Lastly, I will discuss the position of longer-term cycles like the 60-year Gann Master Cycle and the 20-year harmonic.


