NVDA - When will the Music Stop Playing for Nvidia Corporation
#171 $NVDA - Is NVIDIA resonating on the square of 144?
Introduction
Last week, I shared an analysis of INTC, but I also wanted to provide an analysis of Nvidia Corporation. Nvidia is one of the top investments in the chip manufacturing domain and has seen significant growth since the AI boom began.
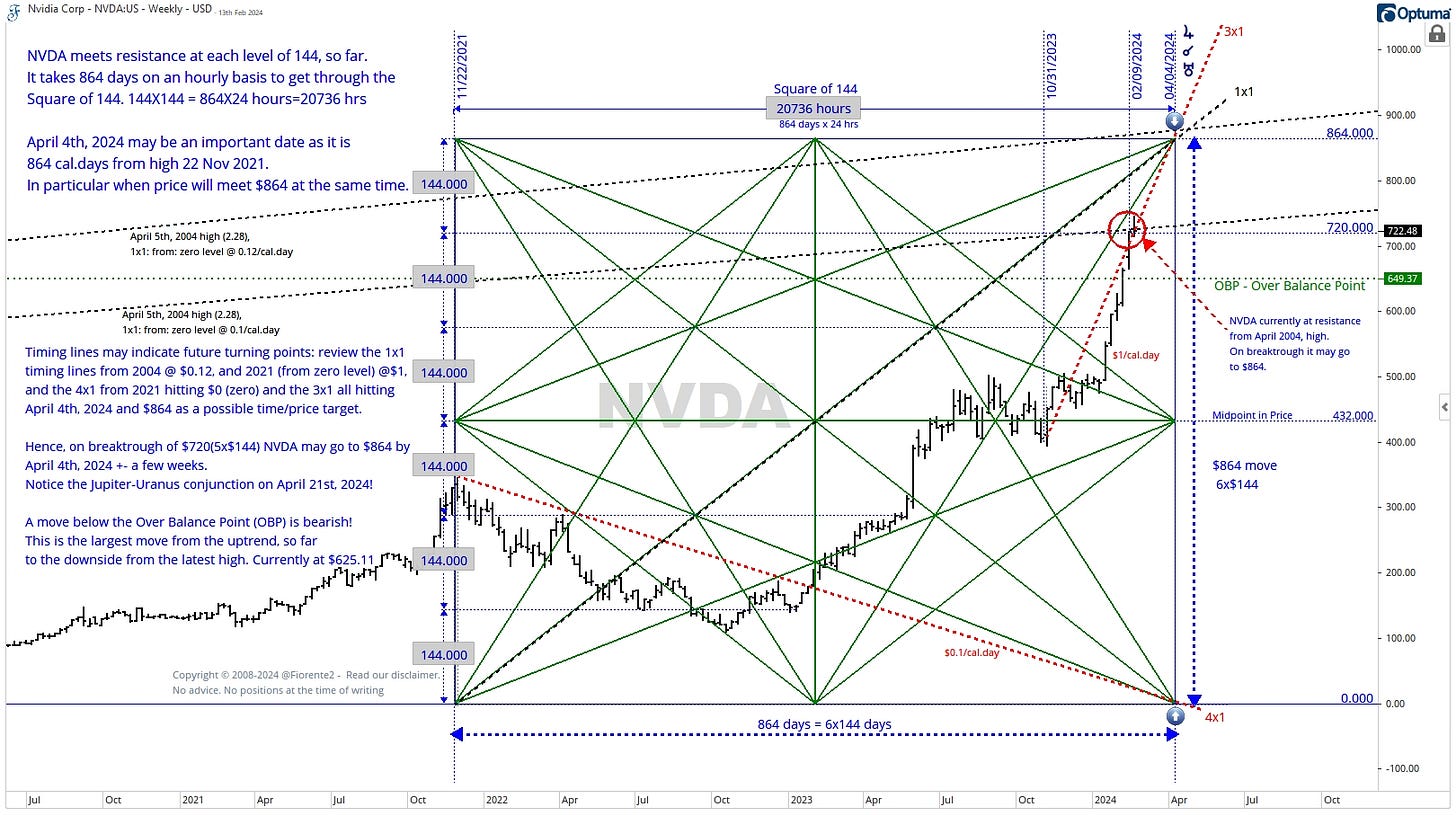
As I was examining the chart, I noticed that we were approaching a 20-year cycle high, calculated from the peak in April 2004. This amounts to roughly 7252 calendar days from February 12th, 2024. If we draw a timing line with a rate of 0.10/calendar day, we can see that it would align with the recent highs, as shown in the chart below.
When analyzing the price progress, the NVDA stock shows advances of $144 with significant support and resistance at each increment of $144.
NVDA is currently trading around 5x$144=$720 and, at a $0.10/calendar day, is also squaring the April 2004 high. This may be an important price and time level that may not be easily broken from below. If it does, the next logical price may be $864, but can there be a price and time equilibrium at that price?
Through W.D. Gann's teachings, I've learned that the Square of 144 is an important cycle in both price and time. On an hourly chart, it takes 864 days to complete the Square of 144. 144 x 144 = 20,736, so 864 calendar days x 24 hours = 20,736 hours.
According to Gann's theory, you can measure the square of 144 from any significant high or bottom. In this case, the first important high occurred on November 22, 2021. If we count 864 calendar days from this peak, we arrive on April 4, 2024. From a Gann perspective, if the price reaches $864 around this day, it may become an important high and potentially lead to a change in trend.
The 4x1 timing line from November 2021 high confirms - on the confluence of the “0”, zero bottom- the April 4th, 2024 date as a probable turning point. Similar does the 3x1 timing line from the lows of October 2023, reaching the $864 price level by the same date.
When will the music stop playing for NVIDIA Corporation? In the below premium subscribers' post, I have analyzed other cycles that could confirm the above analysis of NVDA potentially reaching a significant peak. Using other Gann techniques such as the Square of Nine calculator or converting Planetary Degrees to Price there are alternative price and time targets to be considered as well.
This analysis is intended for general informational & educational purposes only. Hypothetical or simulated performance based on past cycles has many limitations. Cycles can contract, extend, and invert. Anomalies can occur. Hence, past performance is no guarantee for the future. No advice. Please take a look at our full disclaimer.
Disclosure: No positions at the time of writing.


