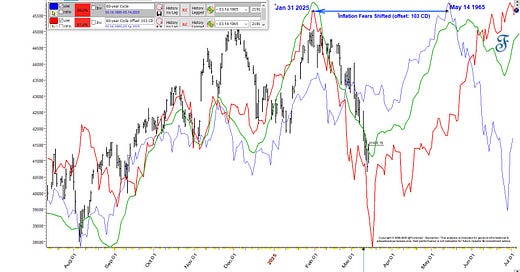
During the last few weeks, the US indices tumbled on inflation fears, reminiscent of May 1965—60 years ago—when President Johnson imposed a 25% tariff on light trucks in response to a European tax on chicken imports. Striking similarities. The 60-year cycle strikes again, a bit earlier than expected.
The 103 CD offset on the 60-year Cycle perfectly shows a similar decline that occurred around May-June 1965, now occurring about 3 months earlier. The same themes are repeating on a 60-year cycle. Even with a 3 month offset, there is an 81% correlation with the current market over the last year. The angle of the decline was even similar.
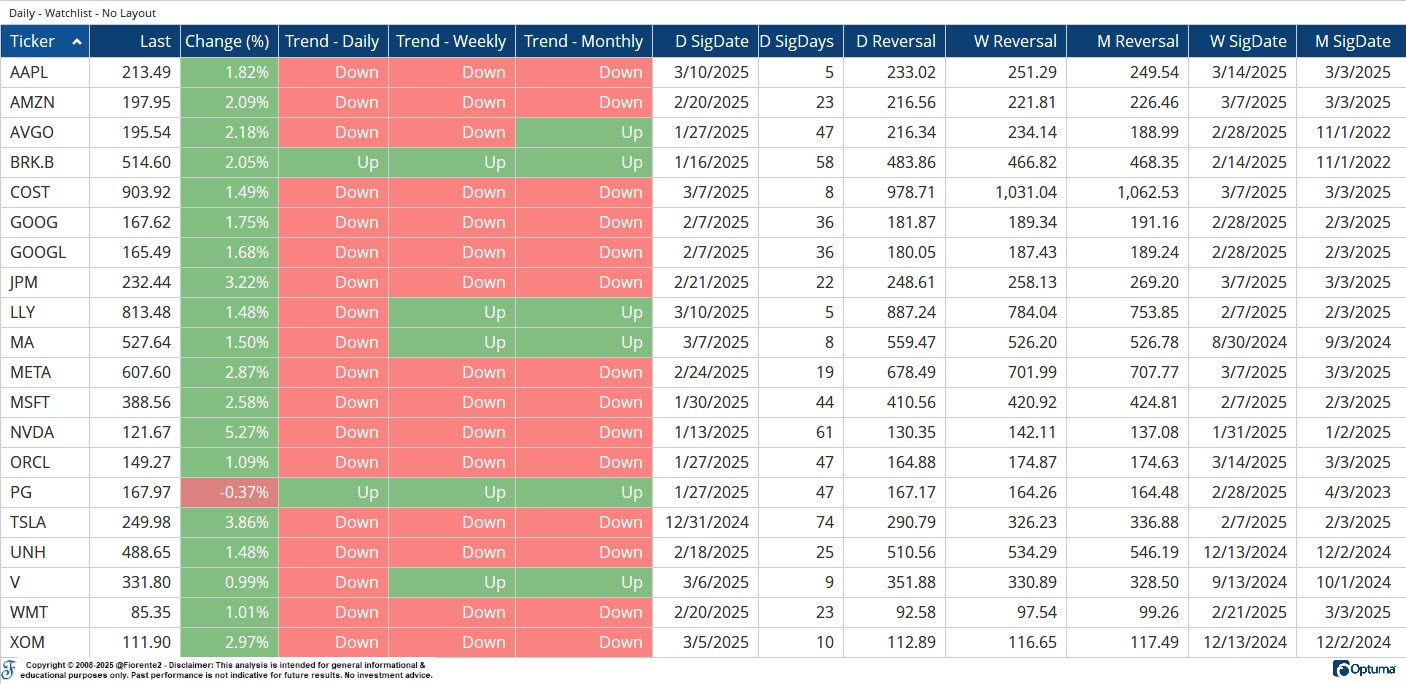
If this offset is correct, it seems we may have seen the cycle low yet. A low was set last Thursday, one day before the lunar eclipse of March 18th. However, if I look at the breakout and reversal levels on the top-20 stocks that boosted the indices last year, I do not think this is confirmed yet.
At the close of last Friday, most stocks were still trading below this volatility-based trend indicator on a daily, weekly, and monthly level. This reminds us of the stock market adage: “Never try to catch a falling knife.”
In this week’s post, I will zoom further into smaller cycles, using vector analysis, that may explain when the next inflection point may occur and Price and Time are in alignment again. I will use vector analysis to gauge where the recent cycles may end.
P.S. The recent decline was foreseen in my Stock Market Outlook 2025 using the Mass Pressure Indicator annual forecast. Please take a look at my recent note for a chart.


