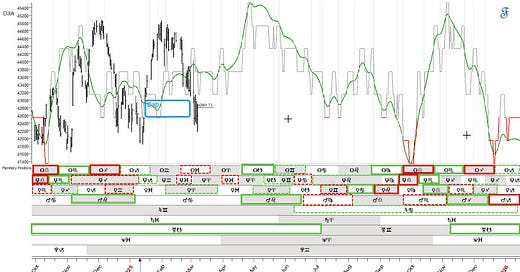
Last week, the stock market has been following the mirrored pattern of early January, trending further downwards. With so many planets in retrograde motion, I remain cautious since the stock market often changes direction at the inflection points when a planet goes Direct or Retrograde. This period has not yet ended, as Venus has just started to go Retrograde, and soon Mercury may begin to go Retrograde as well.
In last week’s post, I introduced the planetary lines of the Circle of Eight (CoE), which are very helpful for identifying future support and resistance. You may remember the chart I posted last week featuring the Circle of Eight which may form future support and resistance levels.
The Circle of Eight represents the average value of the eight planets from Mercury to Pluto. If these price levels align with similar angles from significant inflection points and the foldback, there may be important dates in the future when price and time (longitude of CoE) coincide, potentially marking the end of the foldback.
Last week, we saw how this worked out on the DJIA. In this week’s post, I have added similar charts for the Nasdaq and S&P 500. We will also have an additional look at the 60-year and 20-year cycles' inflection points.


