Introduction
The longer term trend in Gold as discussed in our Fiorente2 Stock Market Outlook 2022 - Third Edition is still intact. As I wrote in May 2022: “I am still weary for a foldback to occur like in 2011-2012 when we had the first top around $2000.“
In the last few weeks Gold has entered a price level that connects with a long term and all time low in Gold. Many times already this line from the 1999 low has been respected. I am not sure it will be respected this time. Bulls and Bears are currently struggling with this line.
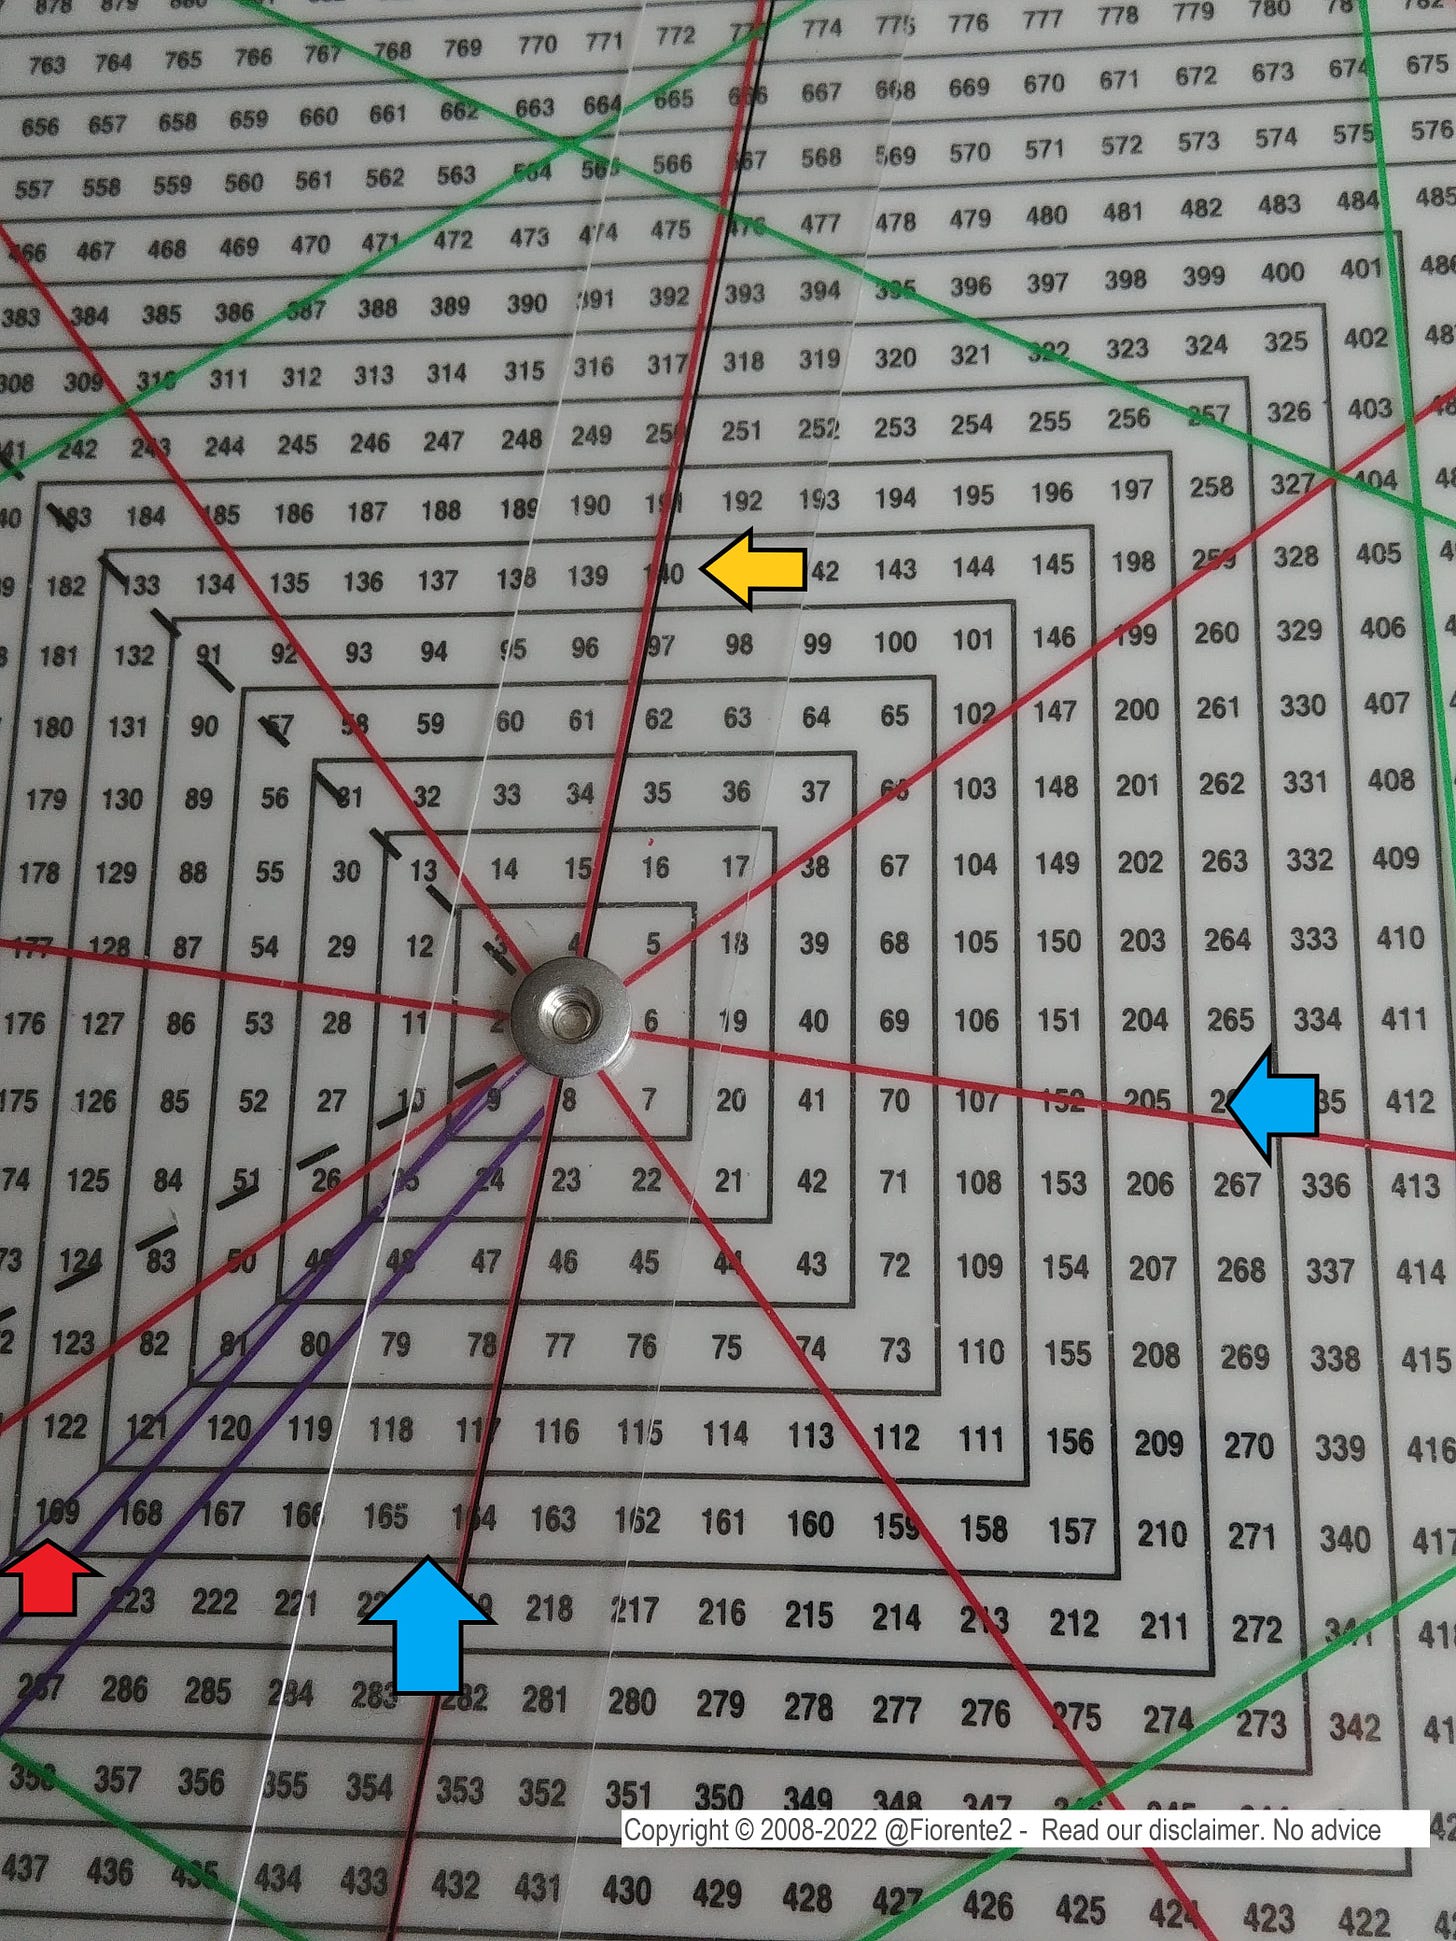
On the Square of Nine Gold is close to 180 Solar degrees from top and the current price level(at the time of writing $1694.50) is on the ordinal cross of 169(0) as you can see in below chart on the Square of Nine (Red arrow). 169 is the natural square of 13. This might be an interesting point of support.
We are currently trading 138 bars (Harmonic of Fibonacci 38.2) from top March 8th 2022. A rebound may be expected in which is possible still a longer term downtrend. Looking at the Square of Nine and the cycles in Gold, Gold may not have seen its lowest point yet.
The premium subscribers can read further from here on the latest update. In today’s post I discuss three probable scenario’s for the shorter, medium and longer term to consider.
Hypothetical or simulated performance based on past cycles have many limitations. Cycles can contract, extend and invert. Hence, past performance is no guarantee for the future. Read our disclaimer.


