Gann Master Cycle update - July 21st 2023
Approaching a cluster of cycles in the DJIA, SPX and the Nasdaq composite.
Introduction
Yesterday, I posted a quote from W.D. Gann on Twitter about July 23rd and its relation to changes in trends in the stock market.
Gann discovered that significant changes in trend occur every 30, 60, 120, 150, 210, 240, 300, 330, and 360 days or degrees from any important top or bottom. He also noted that July 23rd is 210 degrees from December 22nd and 120 degrees from March 21st.
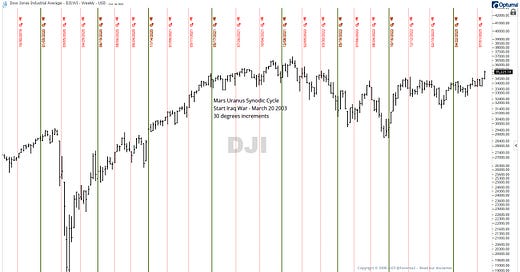
To illustrate the use of this seasonal approach based on past significant events, crests, or troughs, I included the chart below.
The chart shows that the Mars-Uranus synodic cycle that started on an important event in 2003 can still provide accurate cycles years later. The term "synodic cycle" refers to the cycle that begins when two planets align in the sky (a conjunction) and ends at the next conjunction of the same two planets.
The chart displays solid lines that have a 90-degree distance between each other and dotted red lines with 30 degrees. Therefore, starting from the beginning, you can observe every 90-degree movement from the hotspot mentioned in the chart. Since this was a powerful event and 90 degrees is challenging, you can anticipate a response.
This cycle lasts about two years or 702.2 Earth days, during which Mars returns to the same position relative to Uranus1. Financial astrologers find this cycle fascinating because it's believed to be associated with changes in energy, innovation, and sudden shifts in the stock market.
Since Mars is associated with energy, action, and desire, while Uranus is related to innovation, rebellion, and sudden, unexpected changes, the conjunction of Mars and Uranus is sometimes viewed as a time of sudden, forceful shifts that can potentially impact the stock market.
We are approaching a cluster of cycles from important highs and lows, which may be a probable period for a change in trend.
Today, I will share a cluster of cycles coming together with premium subscribers in the next few weeks. As mentioned in last week’s post, the seasonal trend of the major US indices favors a seasonal high in July and a seasonal low in October of the year. The seasonal pattern may not repeat similarly to the past, and sometimes the polarity can shift even for the longer-term cycles, as seen in last week’s post.
This analysis is intended for general informational & educational purposes only. Hypothetical or simulated performance based on past cycles has many limitations. Cycles can contract, extend, and invert. Anomalies can occur. Hence, past performance is no guarantee for the future. No advice. Please take a look at our full disclaimer.


