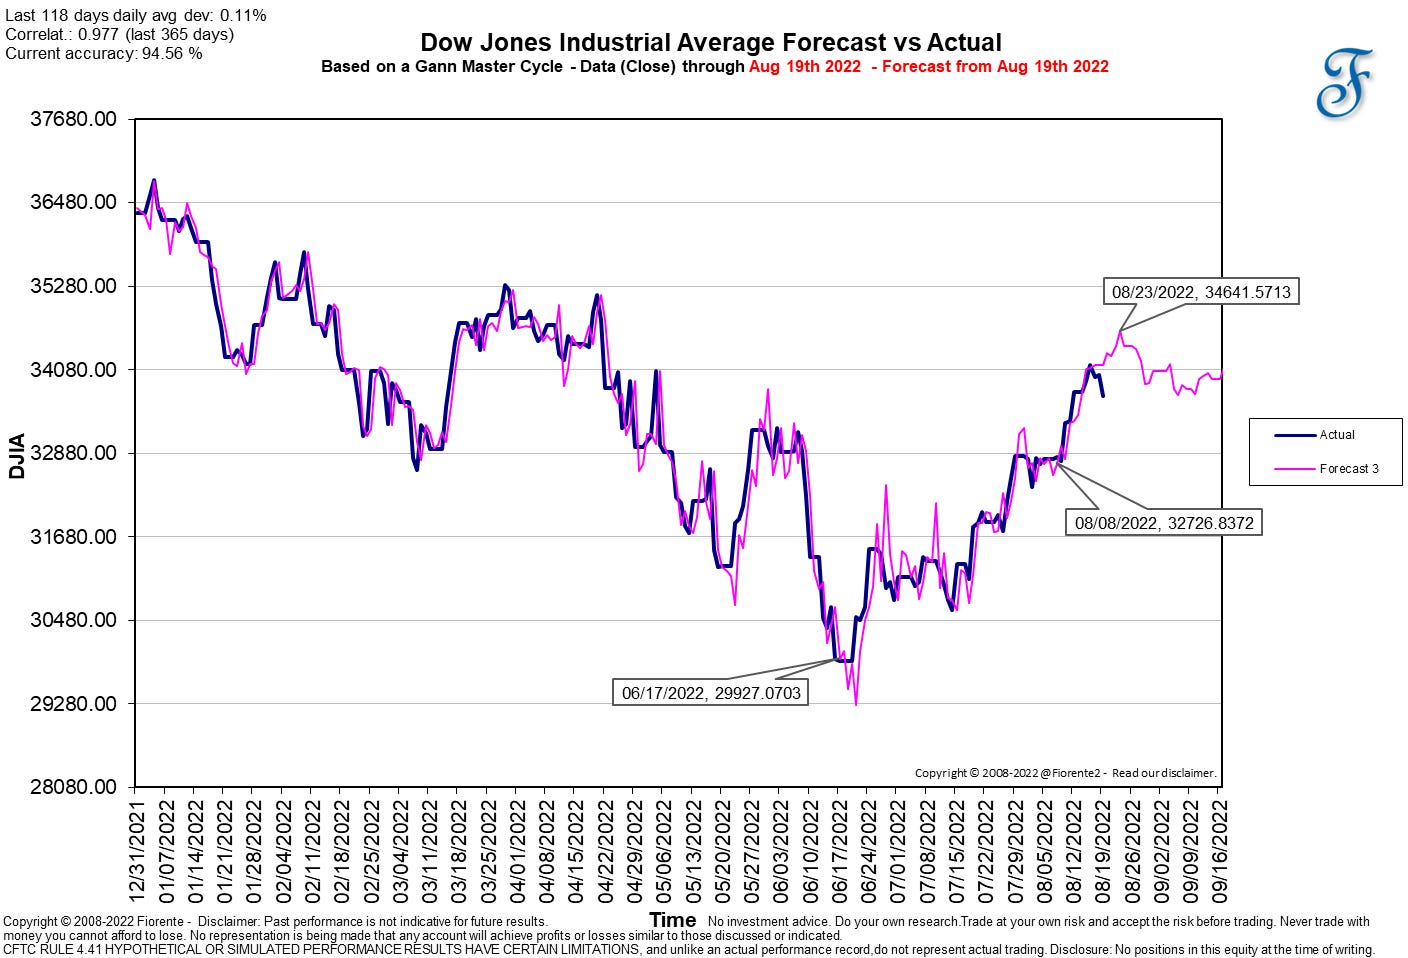
Gann Master Cycle - Aug 31st 2022
$DJIA approaching an interesting point in Price and Time.
Introduction
Today’s intermediate update on the $DJIA, after the close of Wednesday, is an exception. The Gann Master cycle updates are usually posted at the end of the week after Friday’s market has been closed. As we are following a seasonal indicator than is based on past cycles this works fine looking usually a few weeks ahead to give you the feel what may lay ahead in future (if the Gann Master cycles repeat).
The Gann Master Cycle is based upon a cycle that re-occur every +-20 years but they are not always on the same spot in the Zodiac. Every 60 years they come to a point closest to 60 years prior to that time. The theory is that Mass Pressure of the planets that make up the names of our weekdays may be similar as based on based on the past. However it is not the only cycle, so from time to time the Gann Master Cycle can invert, contract or extend. We keep track on this following the accuracy of the forecasts over the last 365 days and post that on each chart we publish.
You can see in below chart that the forecast from August 19th 2022 still showed a projection into the (original) Augusts 23rd high (like in 1962), as there was still room left for an advance to that seasonal high. The market did not (as we know), so it is always good not to trade the analysis, but the chart in front of you. We do not give advice, but only show you what might happen if this seasonal indicator repeats exactly as in the past, which of course will never happen.
Timing lines may help to find relevant points in time and price from past highs or lows, to alert one of a probable change in trend that may occur in the same time period and can further validate if a high or low has been reached.
It is a hell of a job to do this for all of all the charts we (would like to) publish and update regularly. So, the last few weeks I have worked with a partner to develop an automatic way of charting the Gann Timing lines on my charts. Although still in development I can now with just 1-click easily plot the relevant Gann Timing lines from past highs and lows such as: the 1x1 or 1x2 as the most important. Although this is still in development and a few issues need to be resolved this already proved to be of value.
So, beta testing this new app has drawn me to a point of interest in time and price for the DJIA in the next few days or week. I am looking back all the way to the Jan 2009 high and the low of March 2009. I believe in the next few days there may be a relevant point where the market may find support (for now). Please note that timing lines also do not guarantee that they will hold. However, the probabilities increase when multiple timing lines are showing towards a same spot in time and price.
The premium subscribers can read further from here on this analysis of the DJIA in more detail, reviewing angles and other aspects and an updated Gann Master Cycle for this index as well.
Hypothetical or simulated performance based on past cycles have many limitations. Cycles can contract, extend and invert. Anomalies can occur. Hence, past performance is no guarantee for the future. No advice. Read our disclaimer.


