Introduction
We are a few days away from a less known but important seasonal date that Gann mentioned in his Stock Market Course.
“The seasonal changes or monthly changes based on the beginning of any seasonal changes are important to watch for tops and bottoms. August 23rd is 240° from December 22nd.” W.D. Gann - Stock Market Course
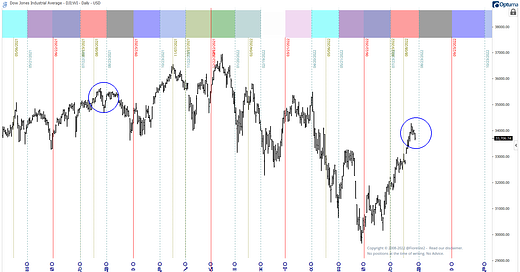
Below you will see all the seasonal dates he mentioned, with the monthly changes in the colour teal.
You can see on the circled sections that last year we made a low into Aug 19th 2021 and this year we seem to replicate that behaviour as if it is within our collective memory the market may turn, upon which traders have reacted. Fractals may work for some time but at some point will cease to work. So, be careful it is only a minor cycle.
The 1 year cycle is the smallest cycle W.D. Gann mentioned in his Stock Market Course in the section on how to Forecast The Stock Market. It is good to keep track of this cycle and other seasonal dates. By overlaying the seasonal dates on your chart you will remember quickly on what happened last year.
Looking at the above chart my bias is we the Stock Market may still not have finished its current rebound from the lows of June 17th 2022. There may be more reasons for when looking back at long-term cycles.
The 60 year cycle is expected to make a crest on this date but this did not make an immediate dive into further lows for sometime. Perhaps this was caused by the previous cycle which did not make a cycle high until the third week of September. The 90 year cycle is just in between.
So from a short and long-term perspective we are approaching a window for a change in trend. Perhaps the market already made its high a few days ago. Clearly the Nasdaq seemed to have squared out on the latest high of August 17th 2022.
The paid subscribers can read further from here on the latest Gann Master Cycle dynamic updates for the DJIA and the S&P 500 as well as an update on Nasdaq Composite. We will be looking back to longer and shorter term cycles to see what we can learn from the past for the foreseeable future using a different chart then last week. We updated the S&P 100 stocks that are expecting cyclical turns in the next few weeks and since last week a lot of stock have lost momentum.
Hypothetical or simulated performance based on past cycles have many limitations. Cycles can contract, extend and invert. Anomalies can occur. Hence, past performance is no guarantee for the future. No advice. Read our disclaimer.


