Follow the primary trend, but remember to set a stop-loss level
#193 An update on the US Indices: DJIA, S&P500, and Nasdaq
Introduction
Last week, I mentioned: “In the short term, expect the US Indices to continue trending sideways or higher on favorable economic news until the end of June or early July following the Mars-Saturn and Mars-Uranus cycles, which may be a similar path to the 60-year and 20-year cycles.” The S&P 500 and the Nasdaq both continued on their primary trend higher. The DJIA continued to trade sideways. Perhaps this divergence in the US Indices signals an upcoming trend change.
Financial market trends can last for weeks and months at a stretch, and the most profits are usually made by following them, whether they are going up or down. It can be challenging to predict when a trend is about to change. Indicators such as stochastic or RSI may not always be reliable guides for monitoring changes in the primary trend. Cycles and planetary aspects can be helpful tools, but planetary aspects may not always signal the end or start of the primary trend, and time cycles can also contract, extend, and invert.
As W.D. Gann wisely stated in his Stock Market Course, “You always make money by following the main trend of stocks, whether they are moving up or down. Stocks are never too high to buy as long as the trend is up and never too low to sell as long as the trend is down. Buy and sell based on definite rules, not hope, fear, or guesswork. Always remember to use a stop-loss order to protect your capital. This simple yet powerful tool can help limit your losses if the market trends against you. Small losses can easily be recovered with a large profit, but allowing large losses to grow can be difficult to recover from.”
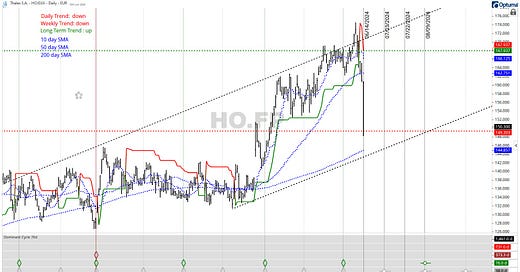
The stock market is dynamic, and the overall direction can shift suddenly. A recent example is Thales S.A., a European company in the defense and aerospace industry, which experienced a 12% drop in its stock price last Friday. This significant change may have been triggered by concerns about high valuations, resulting in a nearly 1-2 billion market value decrease. This serves as a reminder of the need to stay alert and prepared for such market shifts.
The trend-following indicator in the above chart uses the Average True Range (3x/10 bars) values to identify market trends, switching from positive (long) to negative (short) trends. Positive trends are denoted in green, while downward trends are shown in red.
In the above example, you can see that the close fell below the green dashed daily stop-loss level and the 10-day and 50-day moving averages a few days ago and rested on the red dashed weekly stop-loss level. So, the longer-term trend may remain intact unless this stock trades below that level.
Looking at the chart for Thales S.A., it's clear that setting a stop-loss level could have helped investors avoid the 12% decline. Therefore, a trend-following indicator that tracks market trends, whether bullish or bearish, can provide invaluable guidance on where to place a stop-loss level.
Many traders rely on a trend-following indicator that switches between positive (long) and negative (short) trends based on variations in the Average True Range (ATR), typically tracking at a specific ATR over the last X bars, depending on their risk/reward appetite. As the trend shifts, the stock's volatility often changes so that the stop-loss level will be positioned as close to the recent price. When volatility returns, and the price closes above or below the trend-following indicator, it might signal a change in trend. In sideways markets, this tool can sometimes create whipsaws. Higher time frames can be used to analyze the longer-term trends to overcome this.
Remember always to set a stop-loss level. This can help you identify potential shifts in trends, manage risks effectively, and improve your trading in different markets and periods.
This week, I will analyze the primary trend of the US indices from various perspectives: time cycles, planetary cycles, stock market breadth, and the spread ratio between DJIA and the Nasdaq. Additionally, a trend indicator has been included on the main charts.
Note: In the above example and below charts, I used a 3 ATR/10-bar trend-following indicator to illustrate the primary trend and potential stop-loss level. Investors may experiment with their settings based on personal risk/reward appetite. This is not meant to be financial advice or solicitation to buy or sell.


