Did TSLA find support at a Natural Square Number?
#239 An update on TSLA & the US Indices: Nasdaq, S&P500 and DJIA.
In this week’s post, I am looking at TSLA, which surged after the US elections in early November to a high a month later at $484. Mid-December, it bounced off at the natural square of 22 (22^2=484), and last Friday, it found support at the natural square of 19 (192=361), as you can see in the chart below. This is a significant level on the square of nine.
The longer-term trend in TSLA may still be intact, but a close below the monthly $349 breakout or reversal level of the $361 square of Nine level may bring the stock further downwards. Following the dominant cycles and a natural square analysis, I am reviewing a possible path forward for TSLA in terms of Price and Time.
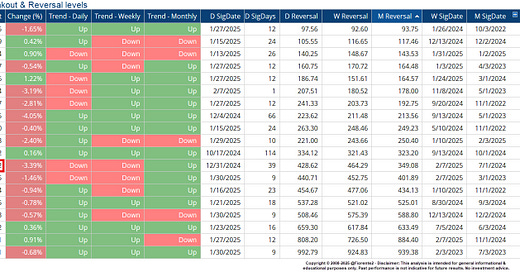
When looking at the other stocks that were part of last year's top 20 US stocks, the situation remains mixed. Some stocks are trading below their daily, weekly, or monthly levels, while others are still trading above those thresholds. This could help explain why US indices have been experiencing a range-bound movement over the past few weeks, a trend that may continue for a while. I will provide further insights in this weekly update on the US indices.


