Did Gold hit significant resistance?
#240 An update on Gold & the US Indices: Nasdaq, S&P500 and DJIA.
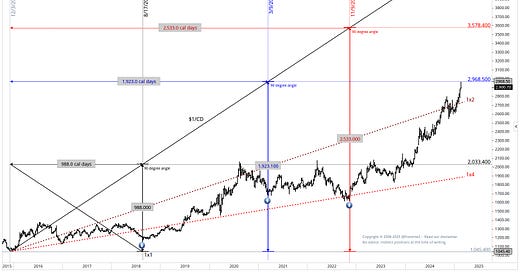
In this week’s post, I am reviewing Gold Futures which surged in the last few weeks to an old time high at $2968.50. In the below chart I will show you how future resistance and support levels can be found by using a 1x1 timing line. This is a “secret method” how you can square Price and Time and find important future inflection points where price may give important resistance and support in the future.
I have drawn a 1x1 timing line (black) from the significant bottom in December 2015. The next significant bottom was found in August 2018 drawing a 90 degree line hits the next future point of price resistance. You can see on the first square that price and time were in balance, but not on a high but a low. The next high where the market will find resistance is at this 90 degree angle from the low in August 2015 at 2033.40. You can see how many years it took to break this high. 90 degree angles are hard to break.
If you are a builder or engineer you may understand that 90 degree angles are hard to break and give excellent support if you put a new floor on it.
As W.D. Gann mentioned:
“Market movements are made just the same as any other thing which is constructed. It is just the same as constructing a building. First the foundation has to be laid then the four sides have to be completed and last, but not least of all, the top has to be put on.” W.D. Gann Stock Market Course
Hence, the next significant low may reveal the next import support and resistance levels. Last week we may have reached that high at a price level of $2,868.50, squaring the low of March 2021. Gold may even surge higher connecting significant lows with the 1x1 timing line.
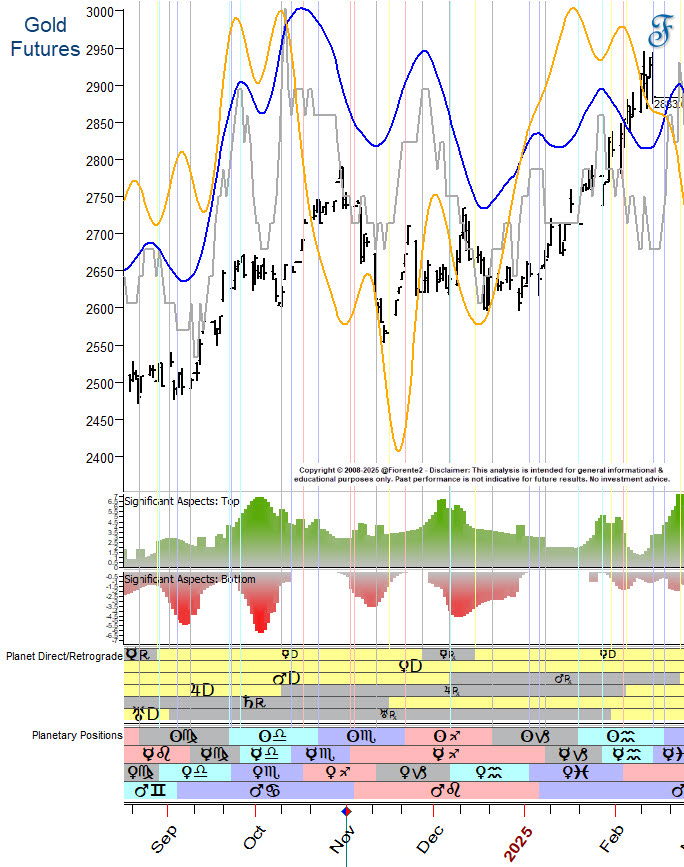
So far, a transit to natal forecast (blue) and annual cycle as featured in my Stock Market Outlook shown in the below chart proved to be following these cycles and signal Gold Futures are close to an important inflection point.
Note: The above transit to natal and annual forecasts do not indicate a price forecast but highlight the likely inflection points based on planetary cycles.
In my Stock Market Outlook 2025, I revealed my annual forecast and important inflection points on Gold. In addition to this forecast, I made today an additional chart showing where Gold may be heading in Price and Time using the above technique amended with planetary cycles.
In today’s post, I have also updated the weekly charts on the US Indices with the most likely dominant cycles.


