As Bitcoin approaches the $100,000 mark, how much longer might this rally continue?
#224 Bitcoin's Rising Horizon: Embracing the Breakout Journey - Part 2
Introduction
Yesterday and today, Bitcoin ($BTC) has reached my initial target. I revisited the post from November 14th, providing an update on the charts along with some minor commentary updates.
As W.D. Gann said in his Stock Market Course: "Always watch a stock when Price is squared by Time, or when Time and Price come together."
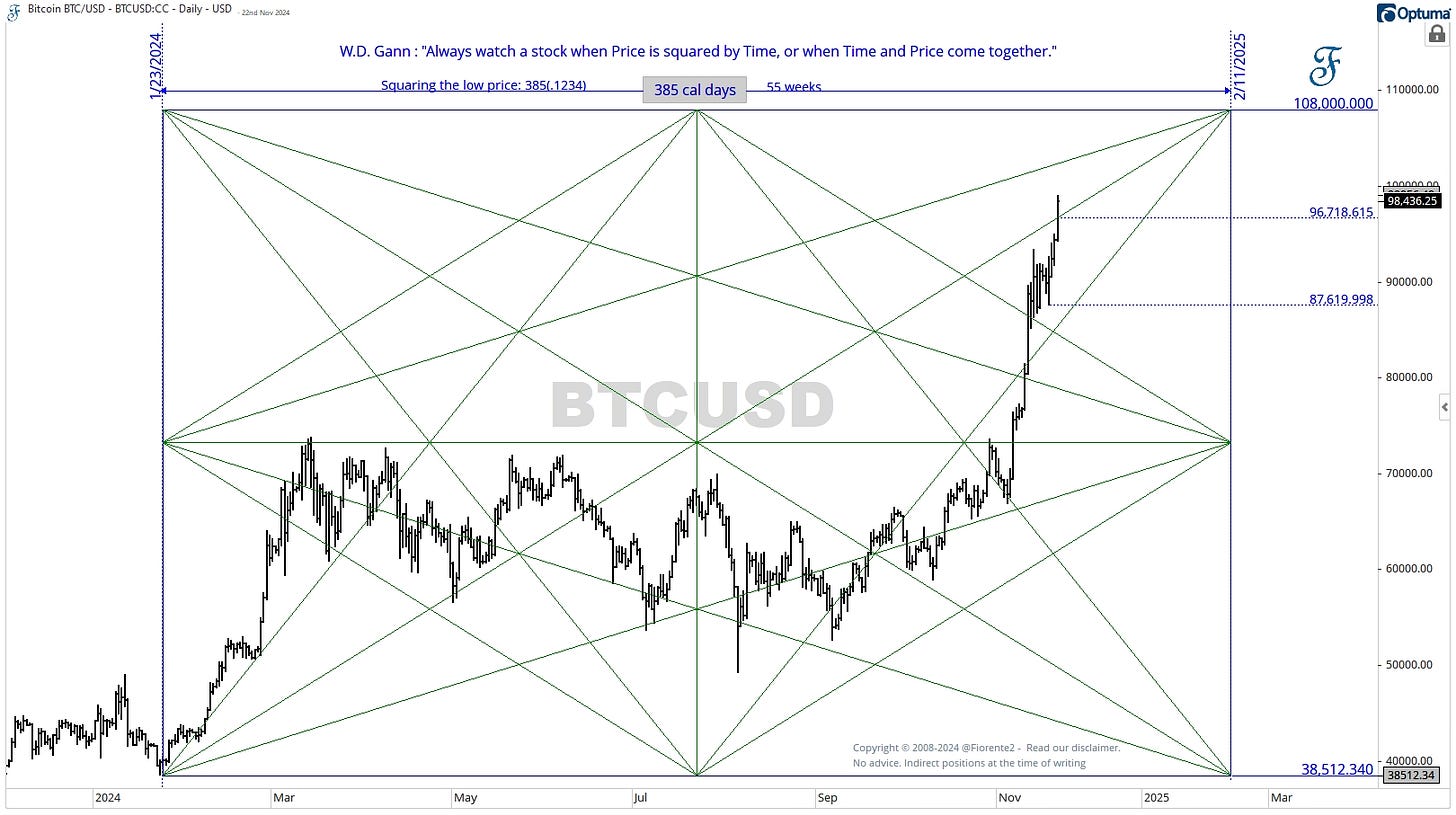
In early 2024, Bitcoin (BTC) reached a low of $38512. If we square this low over 385 calendar days by moving the decimal point to the left (385(12)), it would project Bitcoin’s price towards February 2025. This date assumes a high of around $108,000 on a vibration of $180/calendar day. This date has the potential to mark a high in both price and time, but this is not guaranteed. Changes in trend can occur anywhere along a 1x1 line where price and time intersect, 7/8 part in Part in Time and Price.
As mentioned in my last update, a square out in price and time could occur earlier. In my last post, I mentioned: “The square of 144 shows that we may be headed toward a price level of 96000 by November 16th, 2024, which is 72 days after the recent September low.” We hit that level recently, only a few days later. I also mentioned watching the $99000 level we reached yesterday, only 1 day earlier than expected.
As Bitcoin recently moved fast, I have updated the charts and commentary of my previous post below.
👉 P.S.: My annual forecast for Bitcoin in 2025 will be included in my Fiorente2 Stock Market Outlook 2025. The 2025 edition of my annual publication is currently available for pre-order at a price of $45 until November 29th, 2024. For more details, please refer to last week’s post. (click on the link)


