Are you Bullish or Bearish on Bitcoin?
#248 Analyzing Bitcoin with Parabolic Trends and Chart Patterns
Since the November 2022 low, Bitcoin (BTCUSD) has experienced exponential growth, reaching an all-time high in January 2025. BTCUSD's past price behavior often shows that Bitcoin prices can rapidly increase over time due to an exponential or parabolic relationship between time and price.
This parabolic relationship between time and price suggests that traditional technical analysis may not be suitable for examining price trends and time targets in BTCUSD. Instead, it may be more appropriate to use parabolic trendlines to identify potential support and resistance levels in price and time.
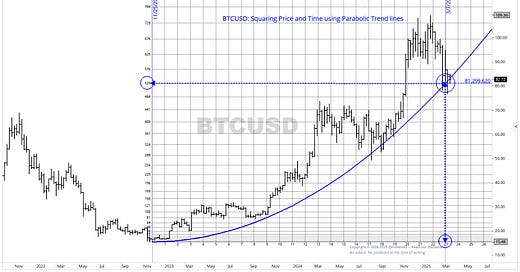
As shown in the chart below, taking the square root of the low in November 2024 establishes a connection with price over time. The model illustrates how prices rise sharply over time, and recently, BTCUSD may have found support along this parabolic trendline.
Along a parabolic trendline, price and time are in balance, often providing support or resistance in the longer-term trend.
I defined time here as the 24th harmonic of the square root of the low from November 2022. This completes 1/24 of a full cycle. Since I use a weekly chart, this reflects the time element in weeks. Why use the 24 harmonics? The square root (sqrt) of a low indicates a potential cycle length (x-axis), but this leads to a less meaningful parabolic trendline. The number 24 represents 1/15 of 360 degrees of a cycle and is often a significant time for a change in trend. Furthermore, BTCUSD is traded 24 hours a day.
In early March 2025, after 23 increments of this time element, BTCUSD found support for the parabolic trendline. BTCUSD is still hanging around this trendline.
The pattern in the above chart resembles a cup and saucer pattern, which may suggest that once the handle is completed, the price trend may continue to increase. This could be bullish. These patterns have a failure rate, and we will have to see if this parabolic trendline holds, but continuing the downtrend from the all-time high may likely bring BTCUSD to a lower price region.
The inherent behavior of traders at the lows also reflects their similar actions overtime at the highs. You can use a similar trendline to plot along the highs. The channels along the highs and lows then capture almost all the price movement we have seen since the low in November 2022.
Likewise, if BTCUSD continues to decline, the same parabolic trendline can be used to forecast the next lower parabolic trendline, serving as potential future support and resistance levels.
The developing chart patterns suggest that the recent declines from the all-time high may not be over yet, and these lower parabolic trendlines could come into play.
In this post, I will demonstrate how the same parabolic trendline can project a trend channel along the peaks, which the parabolic line has linked to the significant highs since November 2022. This trend channel may support the bullish case in Bitcoin. Continuing the decline in Bitcoin, I will demonstrate that the next lower parabolic trendline can be used to forecast future lower support and resistance levels.
Additional charts using planetary cycles and patterns will illustrate to premium subscribers that the downtrend in BTCUSD may not be over yet and indicate potential support and resistance areas in both price and time.
P.S.: This post is intended for general informational and educational purposes only and should not be considered professional advice or a solicitation to buy or sell any security or financial instrument. Trading in futures, options, stocks, and cryptocurrencies involves a significant financial risk.


